Reimagining Books
Escaping linearity
The constitution as a graph
A while back in an edition of the excellent public policy newsletter Anticipating the Unanticipated an idea was mentioned: It would be great to convert the constitution of India into a graph of cross-referencing articles.
I find graphs fascinating and have been using Obsidian to manage my notes for some time now, so I decided to build that graph. Did some initial work programmatically and then manually finished things up in Obsidian. Everything is up on Github.

In a later issue of the newsletter they mentioned this work and shared an observation about how the Directive Principles of State Policy is so disconnected from everything else. That this immediately jumped out makes the case for more visualizations, but it also leads me to think about the formats of books in general.
What is the shape of a book?
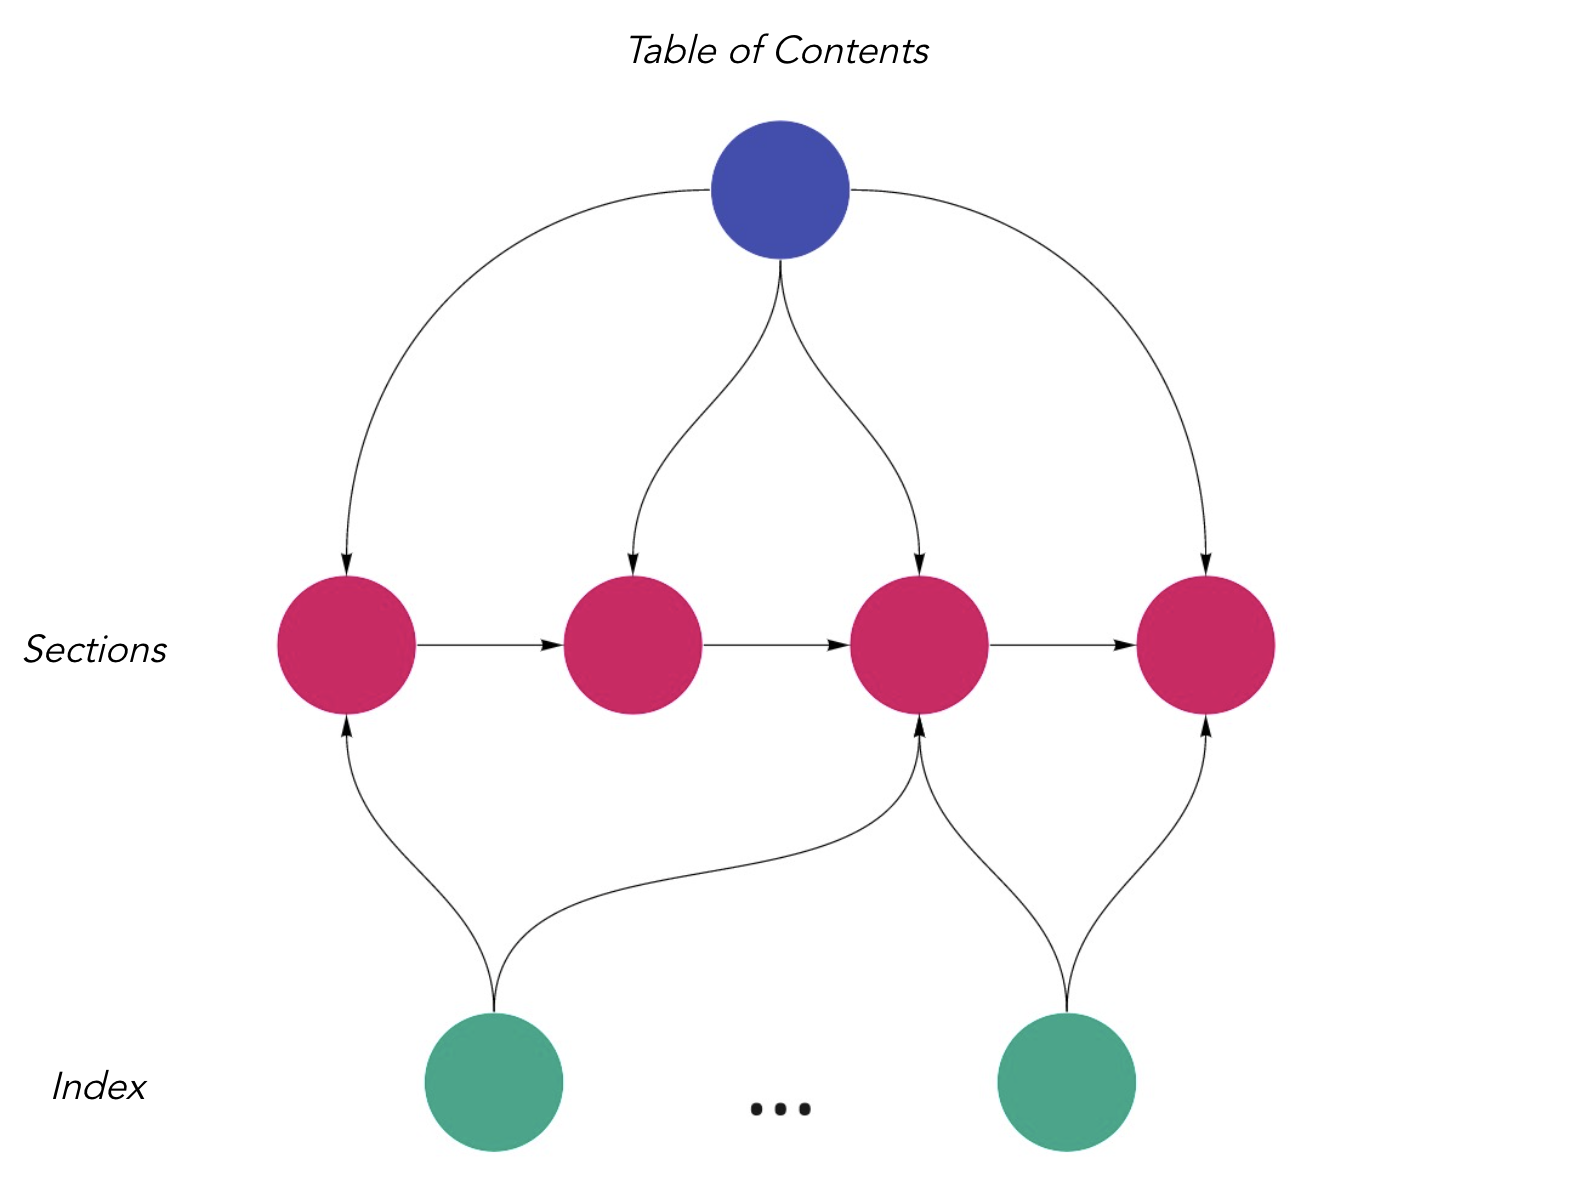
Well, a book has sections for starters.

What you see above could be a collection of short stories or poems. What about novels? They are a sequence of sections.

Now, what does non-fiction look like? Let’s add in a table of contents and an index.

Fiction has tables of contents too but it is not fundamentally useful in the way it is for non-fiction. Non-fiction is non-linear unlike all narrative works.
Linearity here is about the consumption and not a characteristic of the story being told. Memento or Slaughterhouse Five might jump around in narrative time, but they are still consumed linearly by us. “Boy meets girl, there were problems, they lived happily” is a very different story than “they lived happily, boy meets girl, there were problems.” The former is Bollywood while the latter is 5th semester of college.
Books, then, are squashing the non-linearity of non-fiction into a linear form.
Fiction is temporal, but non-fiction can also be spatial as you jump around the sections of a text. An effective reading of non-fiction requires more participation, a sort of dialogue with it, and in that sense is cooler media, to use Marshall McLuhan’s term. But a book’s linearity hampers this participation.
| Narrative | Non-narrative |
|---|---|
| Linear | Non-linear |
| Temporal | Spatial |
| Album | Collage, Grouping stickies |
| Lecture (hotter) | Dialogue (cooler) |
| Books | Graphs? |
There is a lot of advice around how to read better, the most famous being the classic book How to Read. You will notice that they all break the linearity of consumption. They advice you to skim, make counter points, and so on to sort of absorb the big ideas before investing more time. This is a fight against linearity.
Books work well for fiction but for non-fiction a non-linear form will help in exploring a book more effectively and will also make it more useful for someone re-reading it. Why this might be so is hard to explain in text. It is much better to play around with software like Roam Research and Obsidian. Or maybe I should make a video?
Andy Matuschak has talked about why books don’t work and has used new ideas in making the “mnemonic book”, Quantum Country targeting increased retention. Maybe non-linear structures are an idea to be thrown into the mix. I wonder how a mnemonic graph would work.
Needs changes while writing
This is not to say that all existing books can be reformatted to be graphs. The constitution was a special easy case because the articles refer each other. Usually the chapters in a book do not refer to each other so the nodes in the graph cannot be chapters.
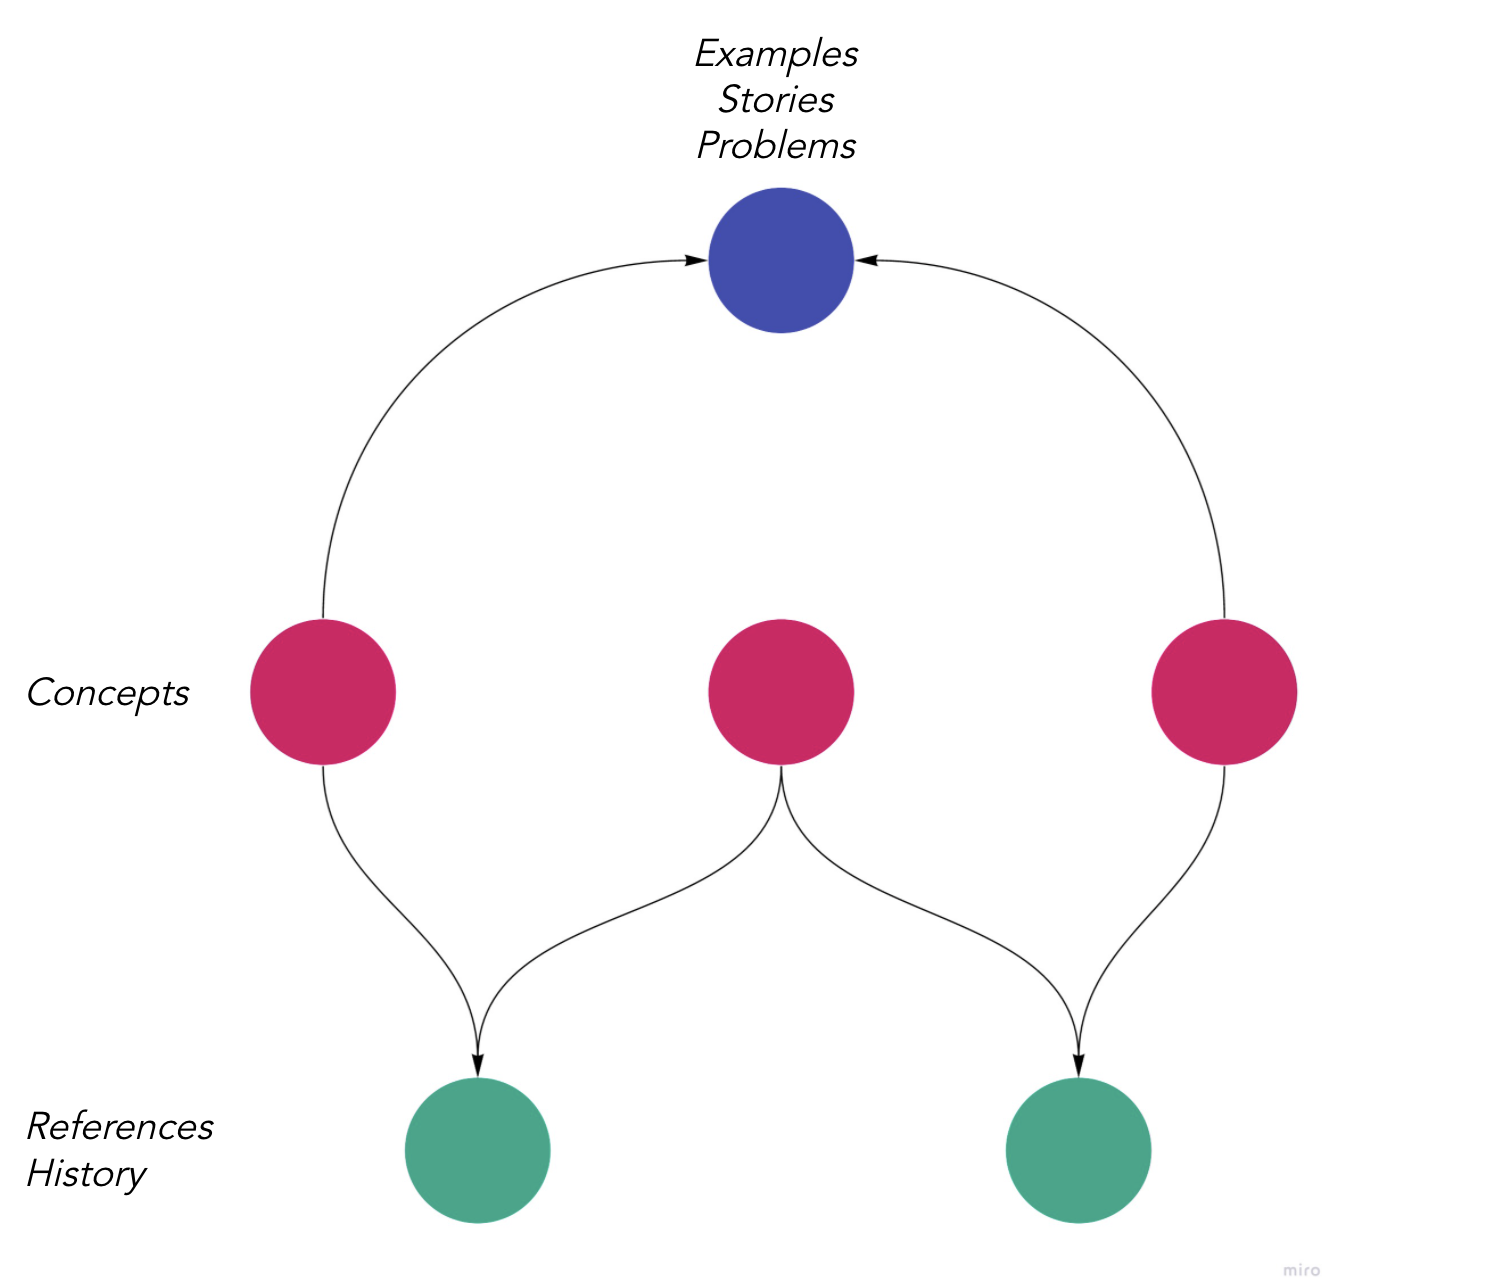
This requires a change in how books are written. The pieces would need to be more atomic. They would be things like concepts, examples, stories, historical notes, and references. The book would tend to be grown, rather than built.
We are already seeing the emergence of Roam-native books. My guess is they do something similar.

Imagine being able to see all the concepts a story illustrates and vice versa. Imagine being able to see the big picture of the book and zooming in and out freely. Would that help us learn better?